
Statewide Comparison User Guide
The Statewide Comparison page aims to show how taxing entities vary across the state, and to put them in context among one another. Where does my county stand among the counties in terms of aggregate revenue? Does my city charge a higher rate than other cities in my county? Is my school district reliant on a similar mix of property as the state overall?
The page contains four charts depicting statewide comparisons. Each chart, described in detail below, responds to the control panel on the left side of the screen. The control panel allows one to select what subset of taxing entities to compare. This is primarily accomplished by the combination of the 'Taxing Entity Type' and 'County' selectors. For example, if one wished to compare among the cities in Summit county, one would set the county selector to 'Summit' and the 'Taxing Entity Type' selector to 'Municipality'. Any arbitrary set defined by type and geography is feasible, although some combinations (such as all municipalities in the state) produce charts which are not useful due simply to the volume of data forced onto the same chart.
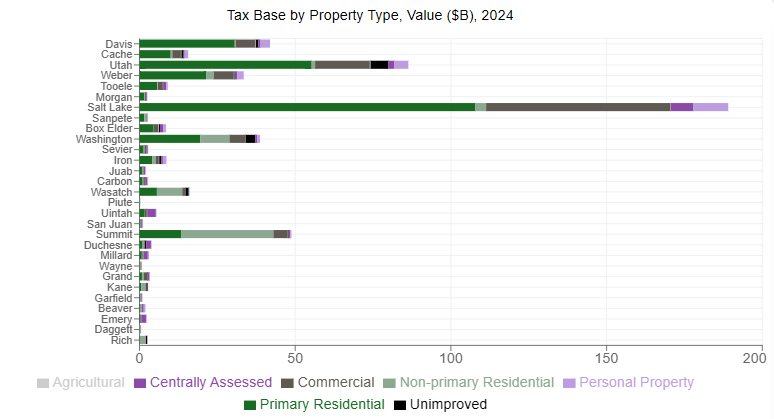
The first chart shows the tax base as the nominal value of property in billions across taxing entities. Each color represents a type of taxable property as detailed in the key at the bottom of the chart. The horizontal distance of each segment corresponds to the aggregate value of that property type in the listed taxing entity. The total length of each bar is the total value of all types of taxable property for that entity.
The values shown here are those reported to the tax commission prior to revenue adjustments and other exclusions. As such, they do not directly map onto the taxable base from which property tax revenues are drawn. The post-adjustment values are reported at a higher level of aggregation and can be found in the Tax Commission's Certifed Rate System. The pre-adjustment values are shown here to provide greater insight into the underlying dynamics of the base which drive potential shifts in liability between property tax types, among other effects.
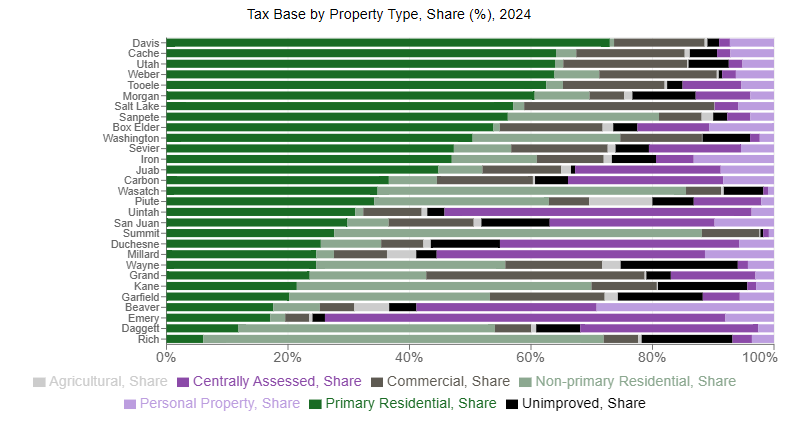
Next to the tax base chart is the same information displayed as percentage shares rather than as nominal values. As a result, the values displayed in the chart are normalized between 0% and 100%. The same relationship between horizontal distance and aggregate values remains, save that here larger segments correspond to relatively larger fractions of the total tax base.
The value of parsing the data this way is to show how reliant a taxing entity is on a given property type. Moreover, it substantiates the intuition that policy changes, economic shocks, or other exogenous changes which disproportionately impact certain property types would not be felt equally across the state.
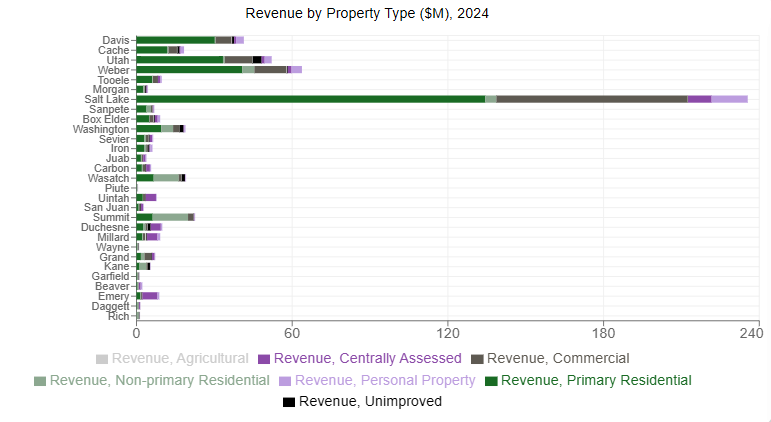
This chart shows estimated revenue in millions broken out by property type across the state. Given that property types are reported prior to revenue adjustments, these values are estimated by parcelling out budgeted revenue by the calculated shares of each property type. Consequently, these values do not exactly map onto the underlying liability experienced by individual taxpayers.
Instead, this view of the data provides a comparison of total entity revenue as well as a first order approximation of aggregate liability experienced by taxable property types. Note that aggregate liability for a property type is a function of the value of properties under the type, the quantity of such properties, and the tax rate charged on them. As such, the information in this chart should be taken in the context of the other three charts as well as those of the entity profile page.
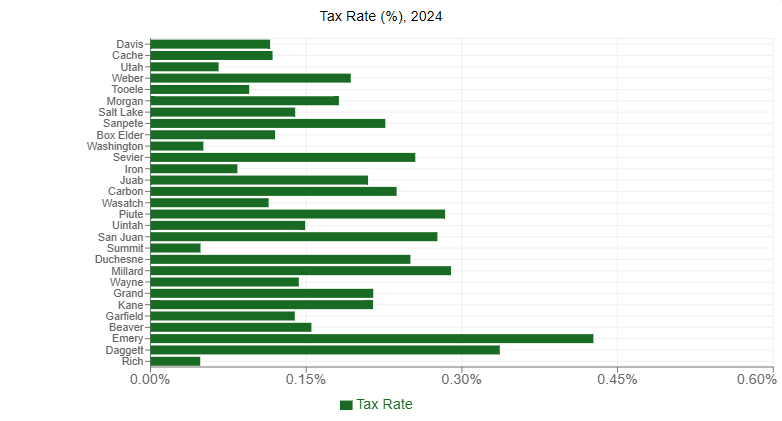
The final chart depicts the certified tax rates charged by entities. These are the values computed by the certified tax rate process. That process accounts for a variety of factors including increases to property values, the new growth adjustment, Truth in Taxation, bonding, the creation of new taxing entities, and many more. Broadly, certified rates are aimed at maintaining flat real revenues to taxing entities over time after entity policy decisions are accounted for.
Just because an entity charges a relatively higher rate does not automatically mean that taxpayers in that entity experience higher tax liability. Tax rates are merely the means to translate between the taxable base and the entity's revenue. The revenue itself is generally a better measure of liability since tax rates adjust up and down in response to value changes.
Take me there!