
Entity Page User Guide
The Entity Profile page focuses in on an individual taxing entity to provide a detailed look at its current status and its recent history. How much revenue does my city collect? What is the tax rate in my county? How have those changed over time? The Entity Profiles page is tuned to answer these questions and more.
The page contains four charts depicting summary measure of the taxing entity at issue. Each chart, described in detail below, responds to the control panel on the left side of the screen.
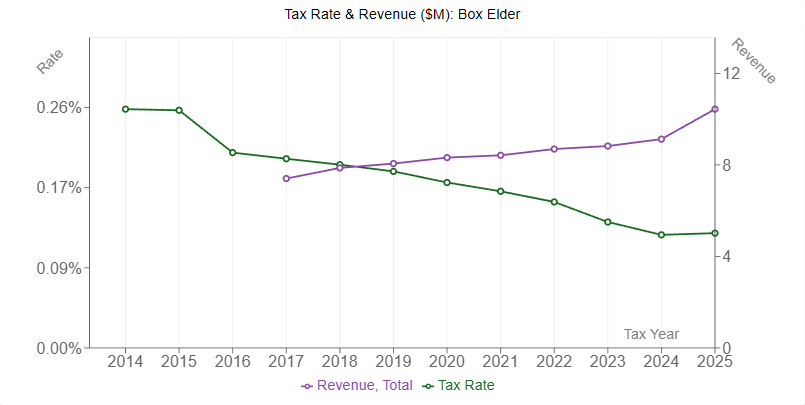
The first chart shows the tax rate levied by the entity in green along with its estimated revenue in purple. Both the tax rate and the budgeted revenue are pulled directly from the Certified Tax Rate system. In order to display both of these measures side-by-side, the chart has two y-axes which scale independently. The left axis displays the tax rate with the decimal position adjusted to improve readability. Revenues are measured in millions on the right axis.
Note that there are a variety of adjustments made to the taxable base and the budgeted revenue for all entities as part of the certified rate calculations. Additionally, the revenue an entity in fact collects will differ from the revenue it budgets due to valuation appeals, tax delinquency and other effects. For both reasons, the revenues shown on the entity profile page are estimates and not actual revenue collections.
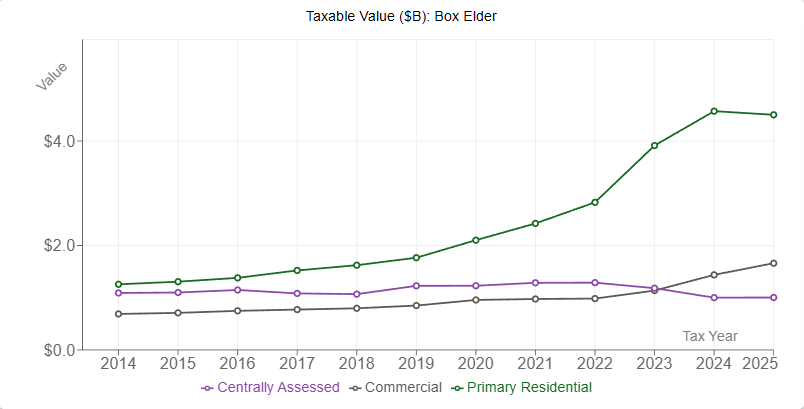
Below the rate/ revenue chart is a chart showing the entity's total tax base by property type in billions. It defaults to showing primary residential, commercial, and centrally assessed property. Additional types can be shown by adjusting the 'Property Types' selector in the control panel on the left of the screen.
In order to break out values by property type, the data needs to comes from an early stage of the certified rate calculations prior to any adjustments or exclusions. This is because those adjustments are applied to a higher level of aggregation. And since the data are not subsequently subdivided back into the component types, the breakdown is not accessible after adjustments are made. This also means that the revenue displayed in the rate/ revenue chart is not directly calculable by applying the certified rate on the tax base displayed in this chart.
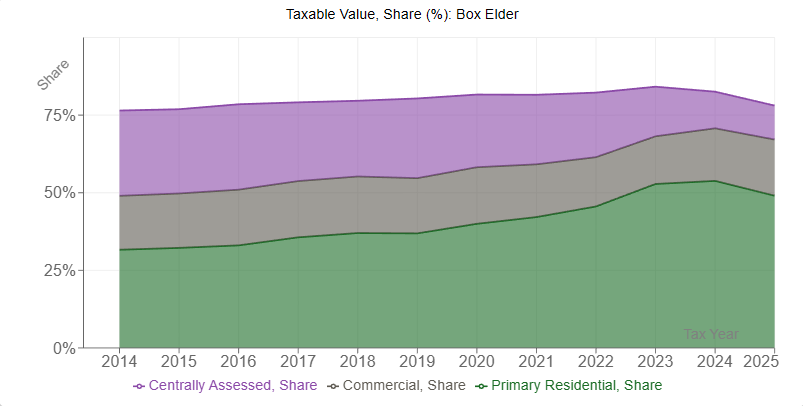
This chart is also shows the entity's taxable value, but displays the information as a percentage share of the tax base rather than nominal values. In particular, each colored region on the chart represents the share of the tax base made up of that type of property with each region stacked upon the previous. This allows one to see which types of property the entity is most reliant on, and how that reliance has changed over time.
Since this is a different way to display the same information as the taxable value chart, it also shows unadjusted values. Consequently, the link between the shares displayed here and the mix of property types upon which an entity relies is not one-to-one since those adjustments do not impact all property types equally.
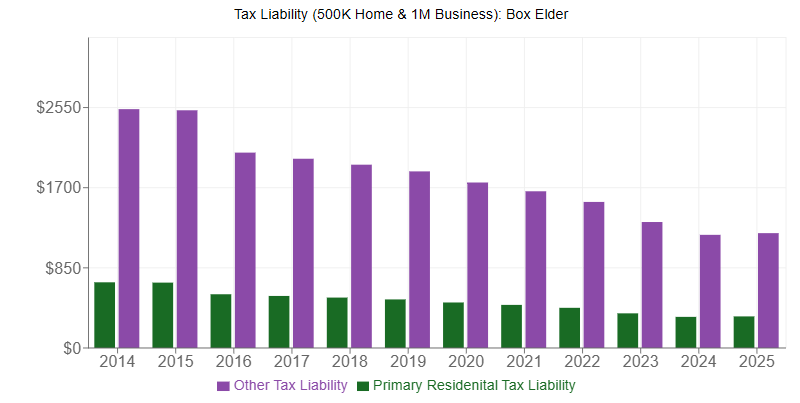
Rounding out the set of four is the liability chart. Its aim is to show the estimated tax liability of a hypothetical taxpayer. The green bars show an estimated liability on a primary residence valued at 500k. Similarly, the purple bars show an estimated liability on a one million dollar business. In both cases, these values are multiplied by the tax rate in a given year to estimate taxpayer liability, although the residential exemption is applied for the green bars.
Note that the values used to compute these estimate liability are fixed and do not vary by entity or year. As a result, actual liability will differ by individual circumstance, and the values displayed here are for instructional purposes only.
Take me there!